“The advent of our disposable culture in the mid-twentieth century has brought with it a new set of ‘local’ materials, disregarded and mislabeled as ‘waste’ ”
In the reCYCLO studio we looked at waste resources that are neglected or otherwise underutilized, in need only of appropriate design strategies to harness them. Starting with analyzing waste trends, we investigated gaps where design interventions could logically be superimposed. Additionally, and in conjunction with a research trip to Amsterdam and Rotterdam, I developed a pavilion design that addressed these principles in physical form. The pavilion laid out a blueprint for a new way of building that looked at waste as a repository of resources, predicated on circular systems, that positions our waste as a positive attribute of our dangerous consumption habits. The structure, comprised from reclaimed sources, uses a modular design that guerilla-sources the manufacturing process with post-consumer plastics and compost, to be disassembled and used again at the termination of the pavilion, or recaptured by the environment as nutrients.
research
Tracking the Trash
Global Municipal Solid Waste Rates (Source: World Bank) Christopher Gallegos & Peitong Chen
“China produces more than 220 million tons of MSW (Municipal Solid Waste) annually”
Asia produces a staggering amount of waste. It is estimated that cities in China produce more than 220 million tons of MSW (Municipal Solid Waste) annually, and counties produce more than 77 million tons each year. Compounding the monumental hurdle of solving this problem, the Ministry of Housing and Urban-Rural Development of China estimates that more than 1/3 of China’s 600 cities are surrounded by trash, around 0.5 billion square meters, quite literally enveloping the country in refuse. Some of the biggest provinces average between 1.9 - 3.12 lb/capita/day of MSW. Worldwide these trends continue to double or triple with the US, Canada and the EU leading the pack with high MSW per lb/capita/day; however, Asia is on track to beat those numbers by 2025.
All US Export Recycling Scrap 2016-2017 (Source: World Bank) Christopher Gallegos & Peitong Chen
“China legally imported 45% of the world’s plastics in 2016”
Recyclable material import trade is worth a close look. In developed countries, the cost of disposing waste is $400 to $1000/ton. However, the cost of exporting waste to China is $10 to $40/ton. Additionally, the lost cost of the ownership of land, labor, and supervision/enforcement also place China at the top of the trading game. Because of the extreme economical benefit of exporting solid waste, China has been the final destination of an enormous amount of solid waste. China legally imported 45% of the world’s plastics, 72% of the E-waste and 56% of the global solid waste production in 2016. By the end of 2017, the total weight of recyclable material imported was almost 40 million tons.
Chinese Landfills (prior to the National Sword Policy c. 2017) - Multiple Sources Christopher Gallegos & Peitong Chen Diagram Animation
The most staggering waste figures are centered around Hong Kong in the New Territories: South East New Territories annually stores 33.2 million tons, West New Territories and North East New Territories each annually store 17.7 million tons, and around Beijing, landfills around Gaoantun and Jilin City continue these trends. As a result, illegal dumping grounds have cropped up around these cities further contaminating rural provinces’ ecologies and affecting public health creating “cancer cities” through incineration facilities spewing toxins into the air.
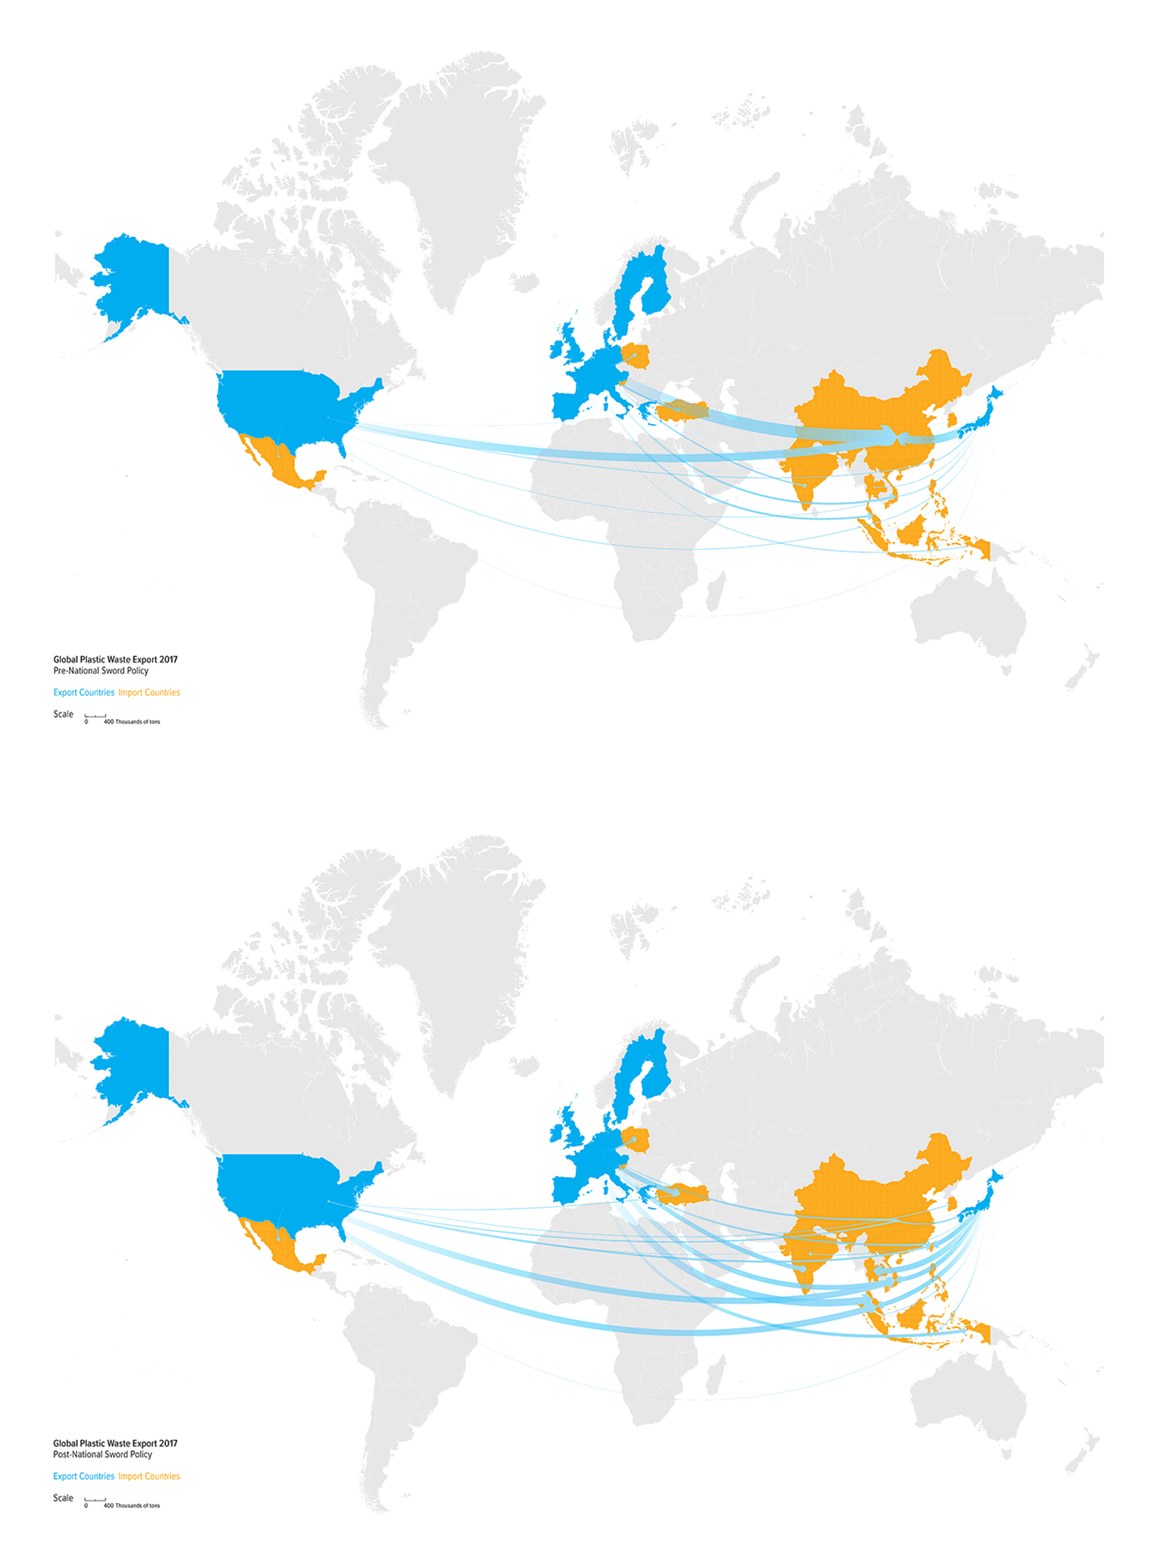
To stop China from becoming the “world’s landfill,” the government imposed the National Sword Policy in 2017 to ban imports of 24 types of waste, and set a tougher standard for contamination levels. Now only accepting shipments of less than .5% trash contamination in recycling imports (as opposed to 5-10%), China took a strong stance to prevent further trash from entering the country. However the appropriate response from the rest of the world has been to redirect contaminated shipments to countries with less stringent regulations, such as with poorer South Asian countries and to increase shipments to Canada, South Korea and Mexico. Additionally, the trash has ended up stockpiled in warehouses, buried in landfills or left to degrade for 450 years in the environment and world’s oceans (North Pacific Gyre)
Pre-and-post National Sword Policy (2017) - Multiple Sources Christopher Gallegos & Peitong Chen
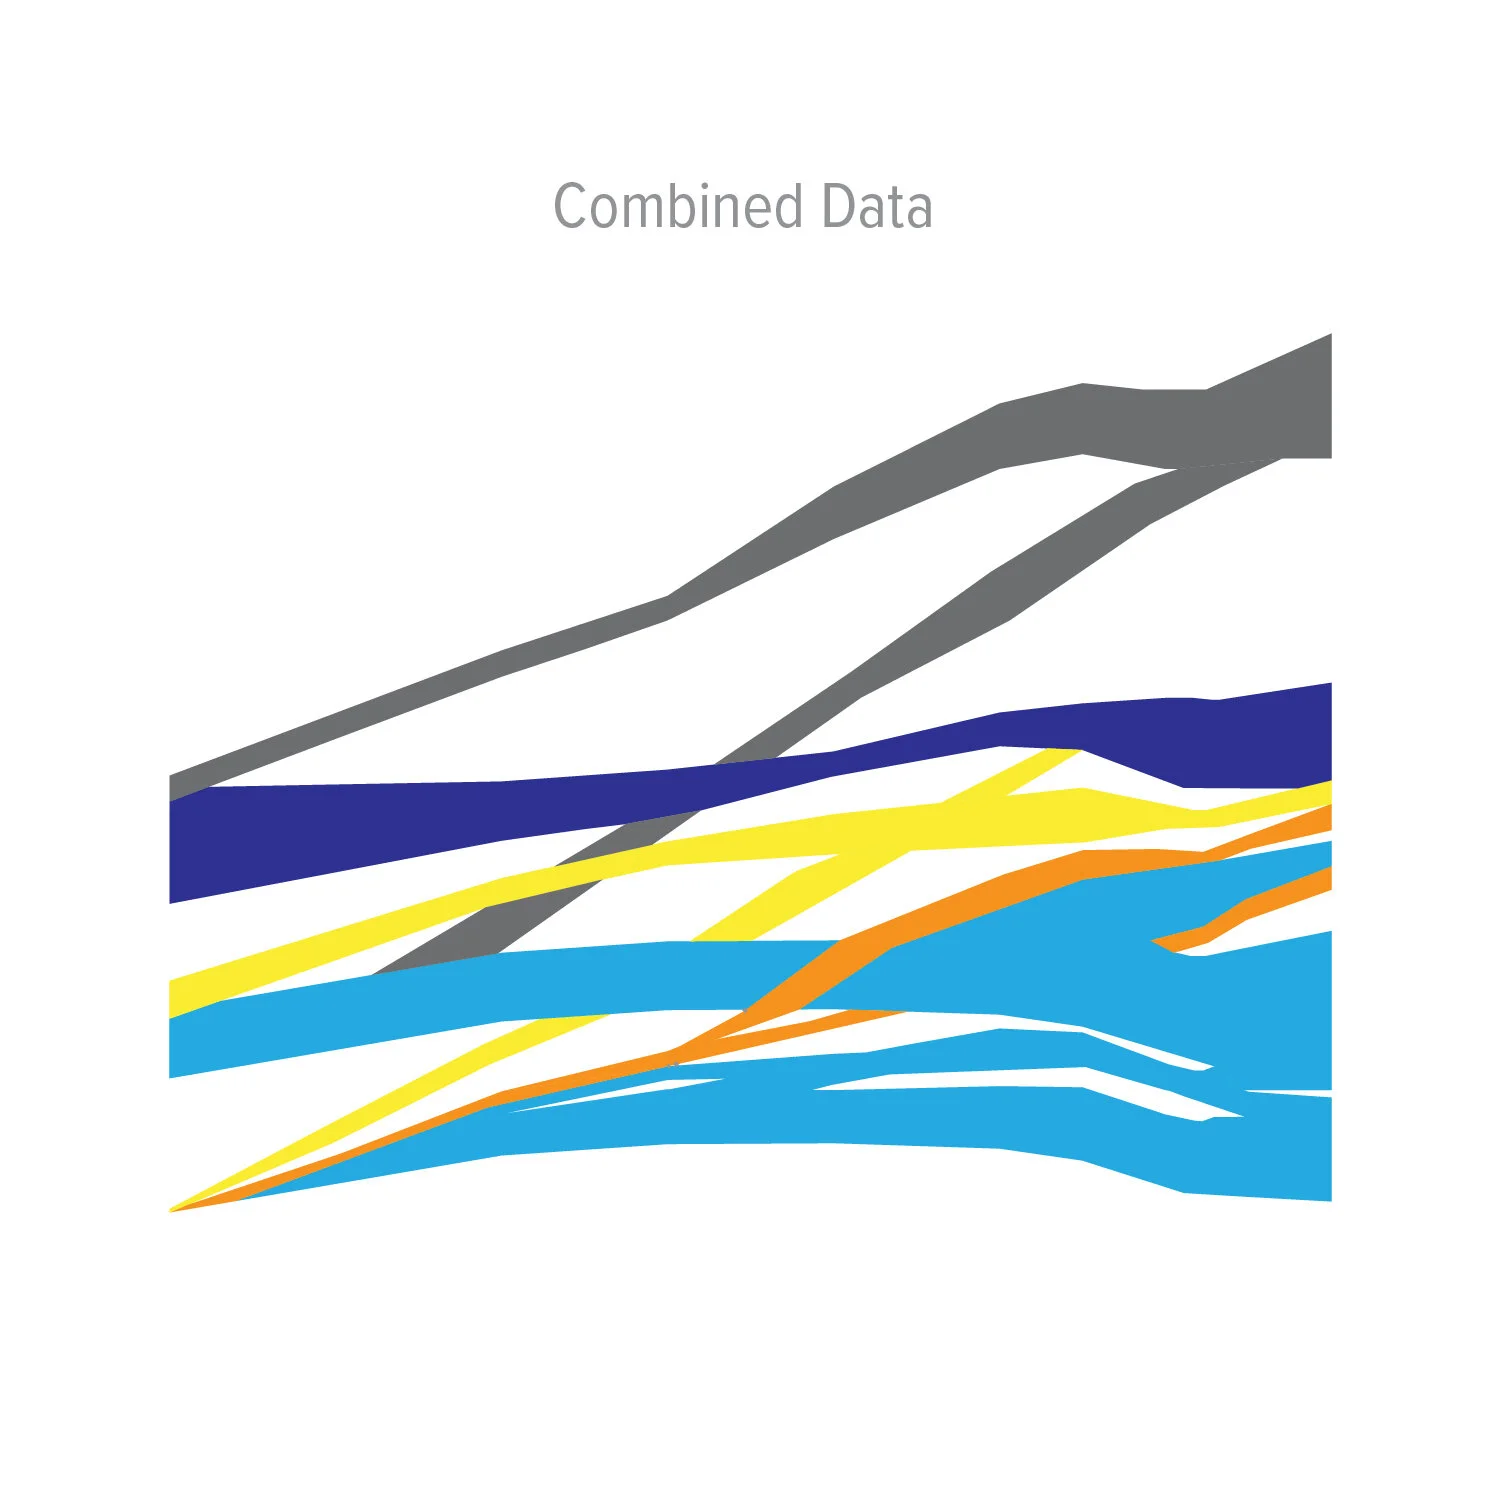
Cradle-to-Grave Properties of MSW Multiple Sources All Human History and the Anthropocene Animation
Sources
"2017 Scrap Exports By Major Commodity". 2018. Institute Of Scrap Recycling Industries.http://www.isri.org/recycling-commodities/international-scrap-trade-database/2017-trade-flows. / Baker-Brown, Duncan. The Re-Use Atlas: A Designer’s Guide towards a Circular Economy, 2017. / Brooks, Amy L., ShunliWang, and Jenna R. Jambeck. 2018. "The Chinese Import Ban And Its Impact On Global Plastic Waste Trade".Science Advances. http://advances.sciencemag.org/content/4/6/eaat0131.full. / Carrig, David. 2018. "The US Used To Ship 4,000 Recyclable Containers A Day To China. Where Will The Banned Trash Go Now?". Usatoday.com. https://www.usatoday.com/story/news/nation-now/2018/06/21/china-ban-plastic-waste-recycling/721879002/ / Cai, Bo-Feng, et al. 2014. "Estimation Of Methane Emissions From Municipal Solid Waste Landfills In China Based On Point Emission Sources".Sciencedirect. https://www.sciencedirect.com/science/article/pii/S1674927814500147#f0005 / Cai, Bofeng, et al. 2018. "Evaluating The Impact Of Odors From The 1,955 Landfills In China Using A Bottom-Up Approach".Beijing City Lab. https://www.beijingcitylab.com/projects-1/20-nimby/. / "Chapter 3: Waste Generation". 2012.Siteresources.Worldbank.Org. https://siteresources.worldbank.org/INTURBANDEVELOPMENT/Resources/336387-1334852610766/Chap3.pdf. / Hoornweg, Daniel, and PerinazBhada-Tata. 2012. "What A Waste: A Global Review Of Solid Waste Management". Siteresources.Worldbank.Org. https://siteresources.worldbank.org/INTURBANDEVELOPMENT/Resources/336387-1334852610766/What_a_Waste2012_Final.pdf / "United States Scrap Trade With China". 2018. Isri.Org.http://www.isri.org/docs/default-source/int%27l-trade/2017isrichinatradesheet.pdf.
City of Dreams pavilion
The DRTY Anthro-MRF
“The typical New Yorker generates 4 lbs of trash a day”
The future of New York City will be zero waste. Every material that will go into creating a household, office, institution or stadium will be recoverable, upcyclable, and reusable throughout its existence. Everyone will be accountable not just out of necessity but out of responsibility, and incentives will spur a net increase in services and amenities, with a healthier general population. The result? A new blueprint for building and a much greener world.
Our linear system of consumption is broken. In NYC we follow the predictable pattern of consume-and-discard with total diversion from landfills hovering around only 17.4%. NYC’s ambitious goal of achieving zero waste by 2030, in line with the OneNYC vision, is an incredible aspiration but there is still much to do. The construction industry faces a similar hurdle: Construction & Demolition (C&D) waste is up to 19,000 tons of waste each day with approximately 10% being diverted from the waste stream by Not-for-Profit and commercial services. This shows there is ample opportunity to change the system.
Mock-up Model for DRTY Anthro-MRF
What if the very signifiers that define the epoch of the modern-day man, the Anthropocene, are its greatest strength? Instead of being remembered for chicken bones, plastic bags, and construction debris, we can be remembered for leaving nothing at all, fully utilizing all at our disposal and contributing more resources back to the environment. It starts with changing our perceptions.
A Dirty MRF is an expression used in the Materials Recovery Facility (MRF) industry that refers to the capturing of 100% of the waste stream (ie. one bin for everything you would throw away) in a sophisticated sorting facility. While the idea of convenience to the consumer is appealing, it rejects their accountability in addition to being more labor-intensive to operate, and ultimately more expensive to the tax-payer it was intended to convenience in the first place. By changing our perceptions at home and increasing our knowledge as to what can and cannot be recycled, we can take ownership of our waste and develop something new.
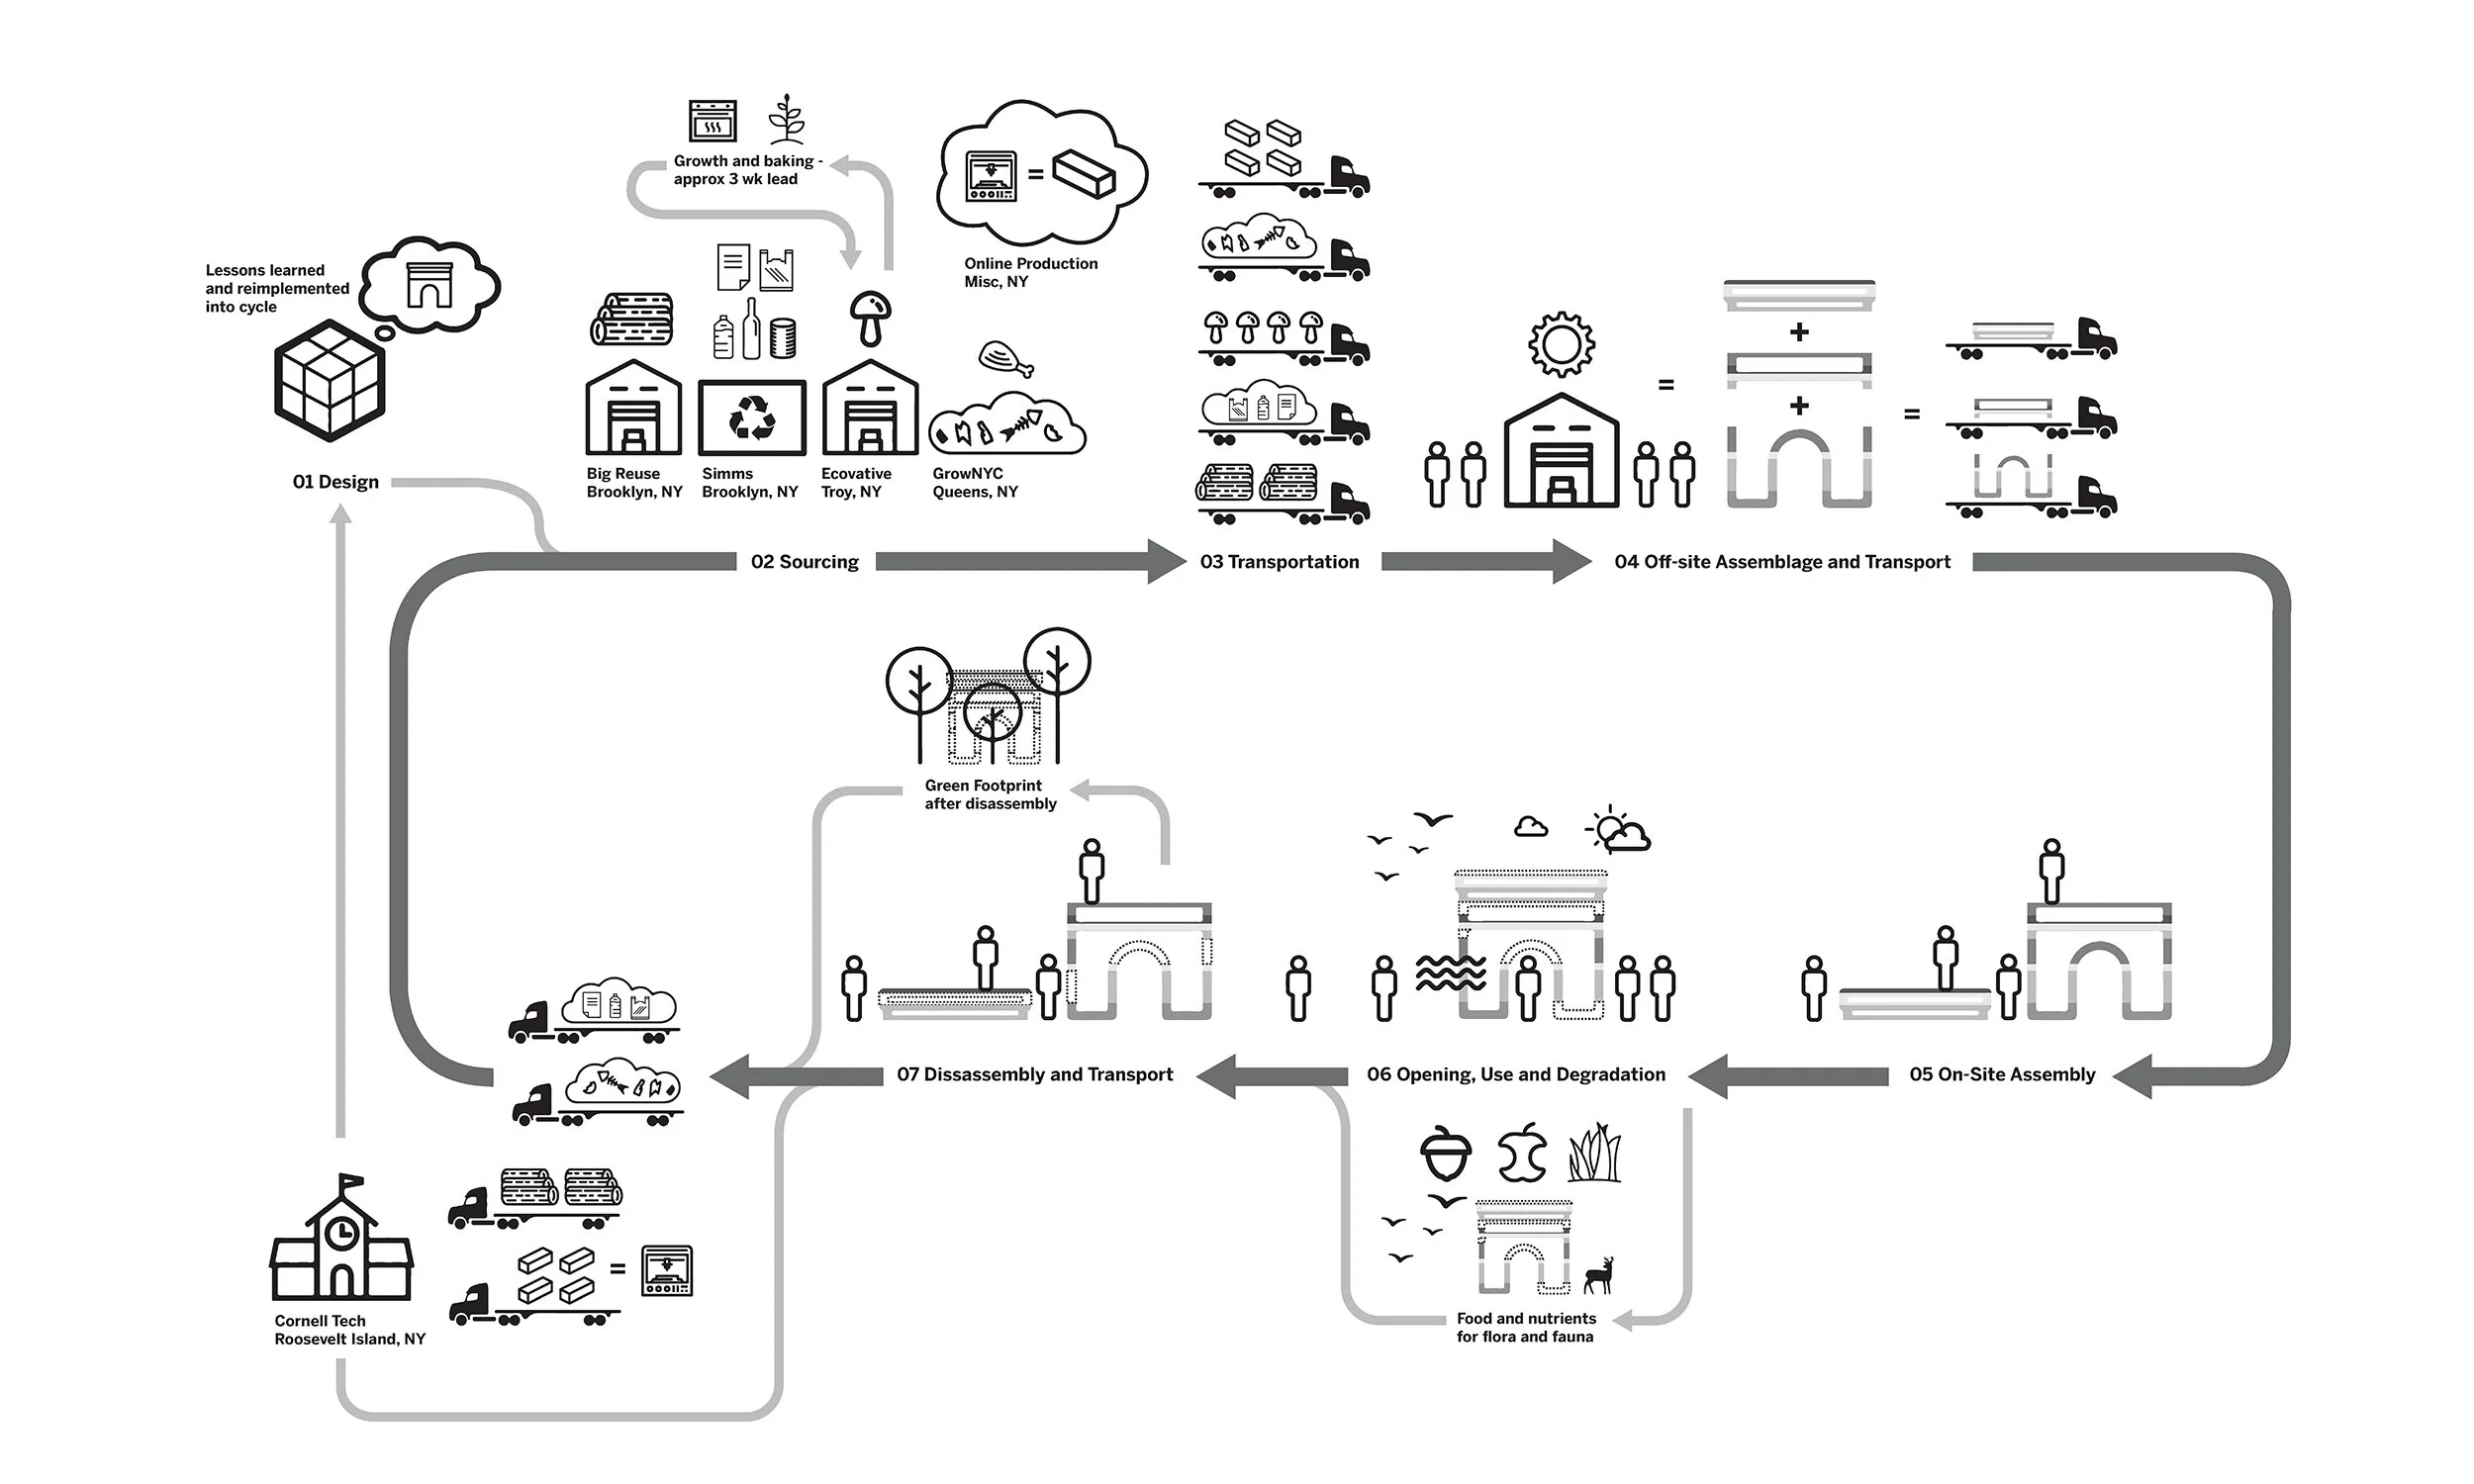
A circular economy, as the Ellen Macarthur Foundation illustrates, challenges the linear paradigm of consumption by circulating products and systems at their highest utility in both technical and biological cycles through processes that regenerate, share and optimize. This means that buildings become material banks or sources of “food” to continually build from; In other words, the usefulness of a material is considered throughout every part of its life-cycle. This is the underlying tenet behind the City of Dreams pavilion.
Cradle-to-Cradle Process for the DRTY Anthro-MRF
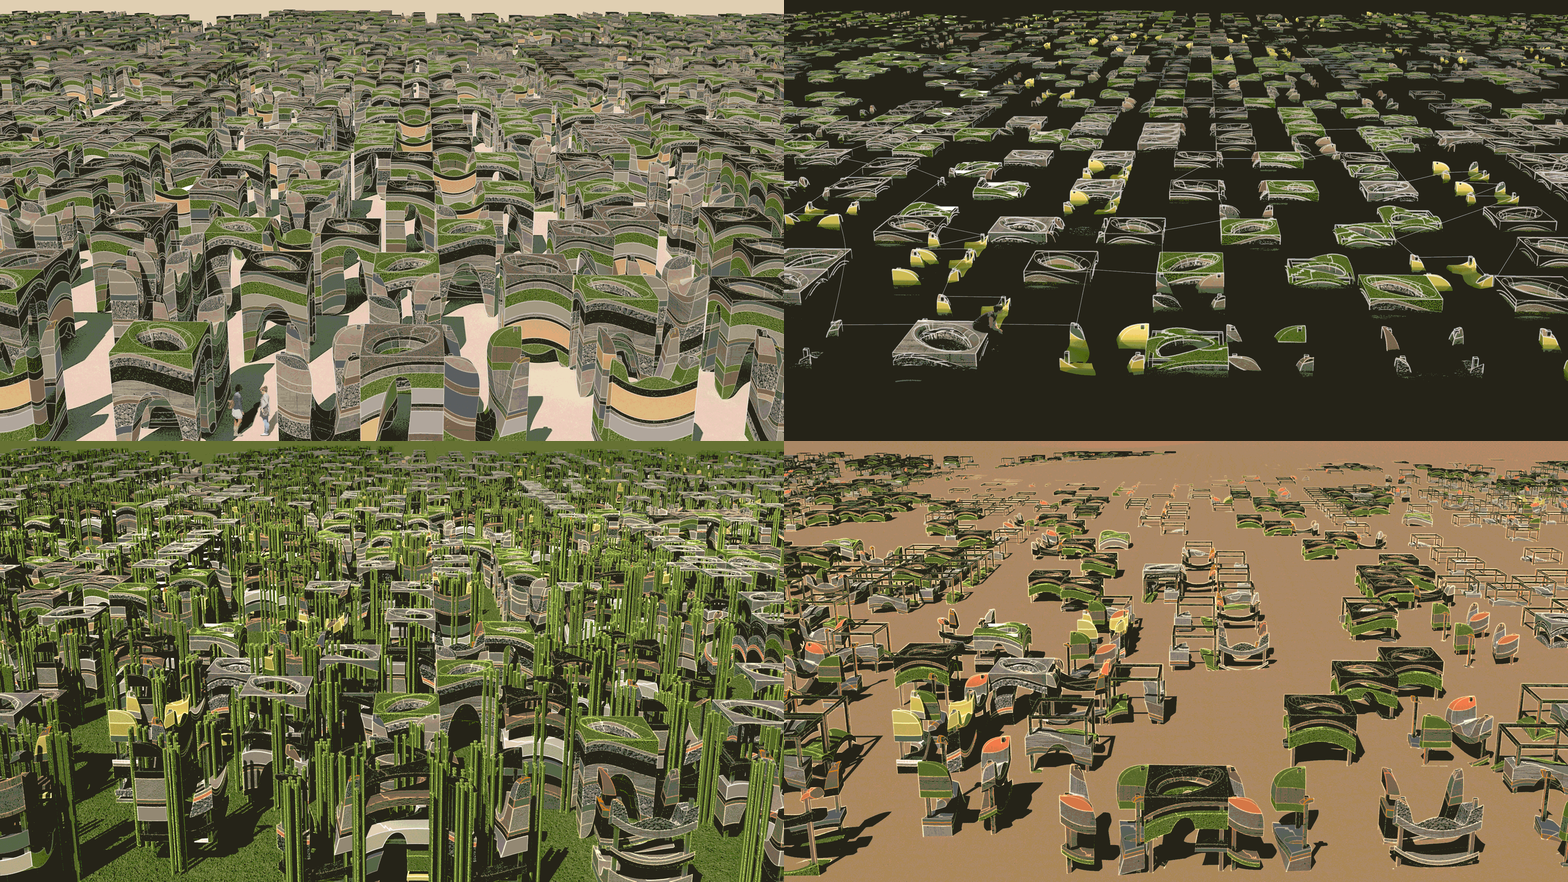
Pavilions Deployed En-Masse (Early Time-lapse Concept)
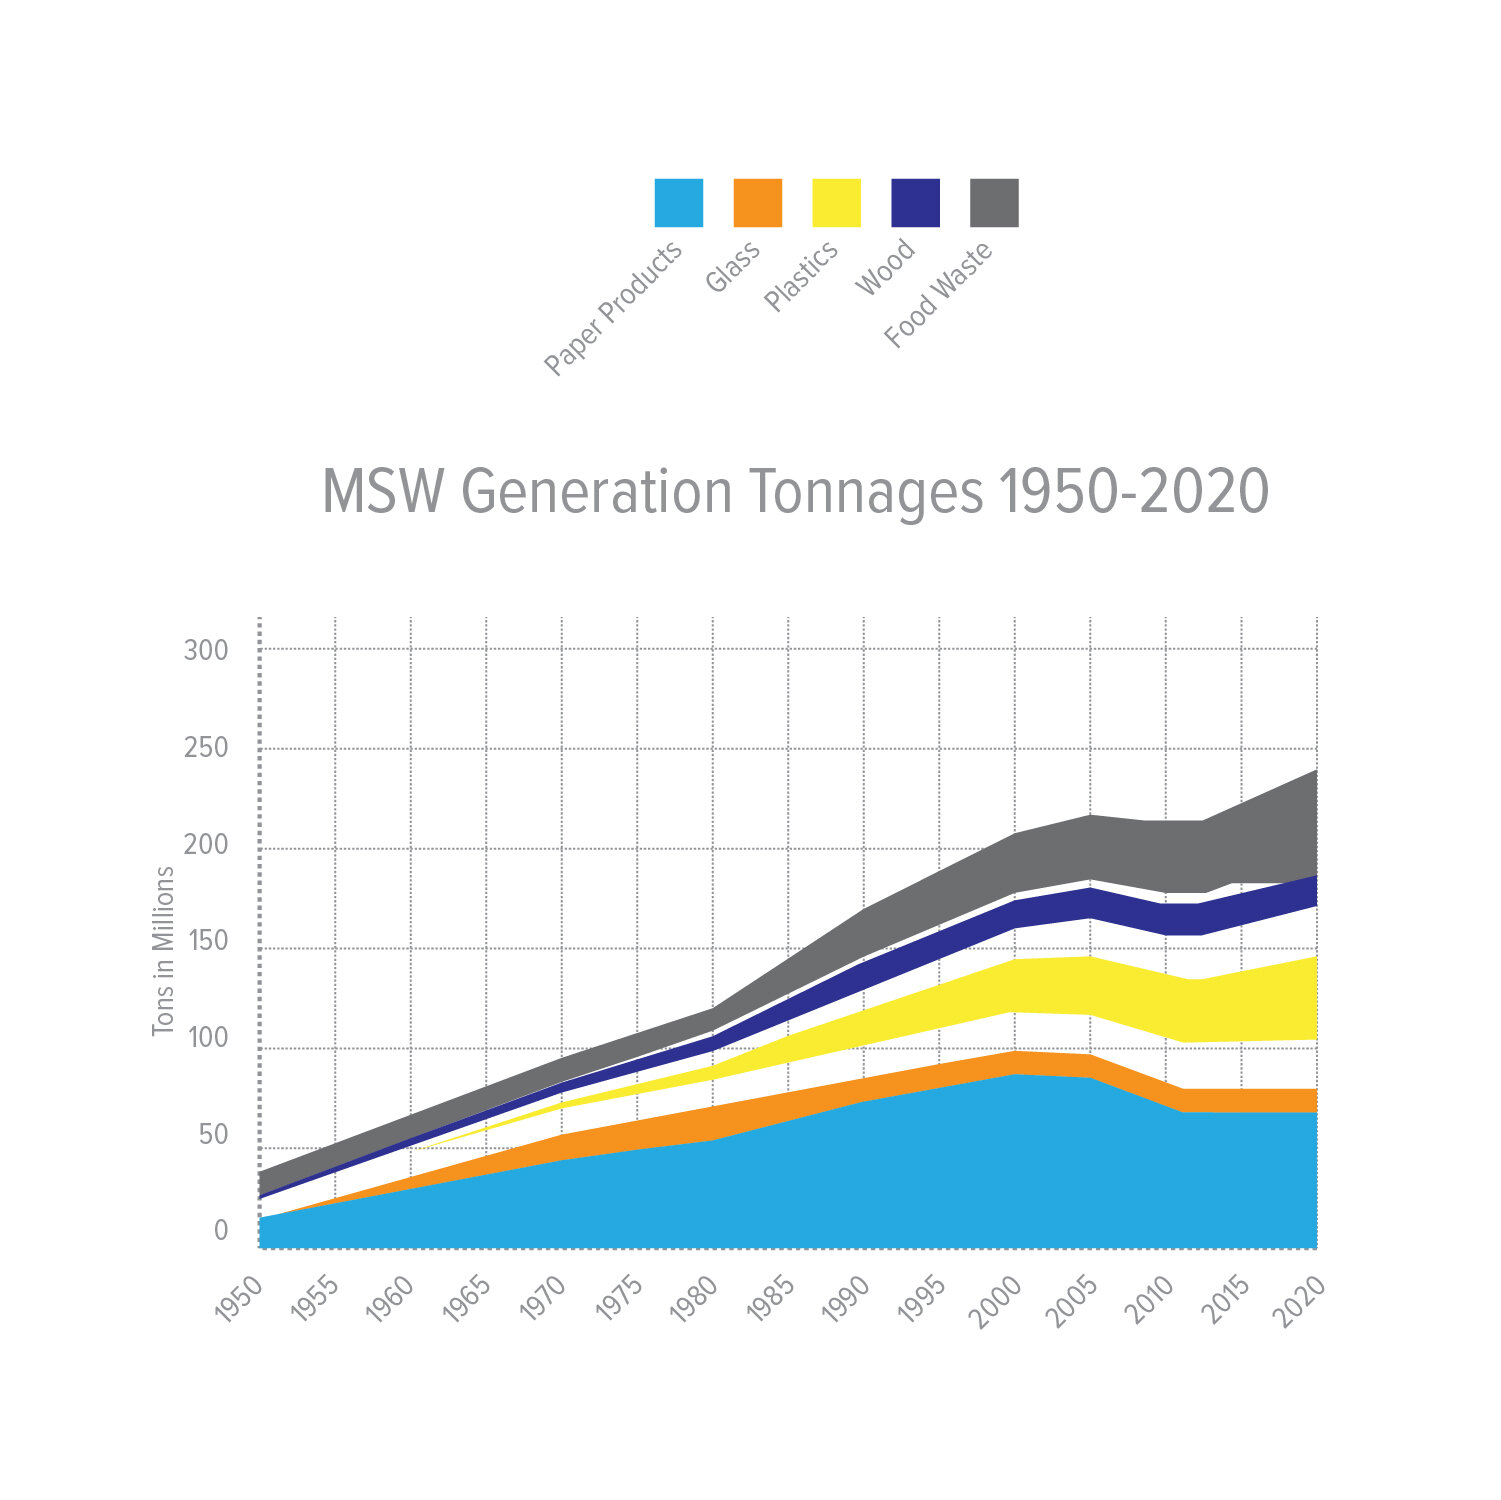
The DRTY Anthro-MRF is a simulated microcosm of these principles in action for the City of Dreams Competition by FIGMENT. Every component of the construction is either borrowed, biodegradable, or reusable to be returned to its source, the Earth, or utilized in a different capacity at the end of the pavilion event. The form is derived from an EPA study of waste trends in the US from the 1950s through to 2020, capturing Municipal Solid Waste generation and landfilling, with recycling and composting subtracted (all measured in tons and separated by material). The highest contributors to waste are paper, plastics and food waste. The DRTY Anthro-MRF captures these signifiers, illustrates them in a physical manifestation of waste with these elements, and challenges visitors to own their consumption habits.
Early Model Time-lapse
From Data to Form
Early Form Derivation
Detail
Construction and Fabrication Drawings
Pavilion in use on Roosevelt Island
Sources
Carrington, Damian. 2016. "The Anthropocene Epoch: Scientists Declare Dawn Of Human-Influenced Age". The Guardian. / Ellen MaCarthur Foundation / “Essential Info: Goodwill NYNJ + Big Reuse.” Open House New York (blog), April 2017. / Material Recovery Facilities / “OneNYC: The Plan for a Strong and Just City.” Vision 3 Goal: Zero Waste. / US EPA, OSWER. “National Overview: Facts and Figures on Materials, Wastes and Recycling.” Overviews and Factsheets. US EPA, October 2, 2017.
The Lynn Project
Ubiquitous De-Consumption
“In 4 Years, capacities of landfills will be exceeded and Massachusetts will be forced to ship 2 million tons of trash outside its borders”
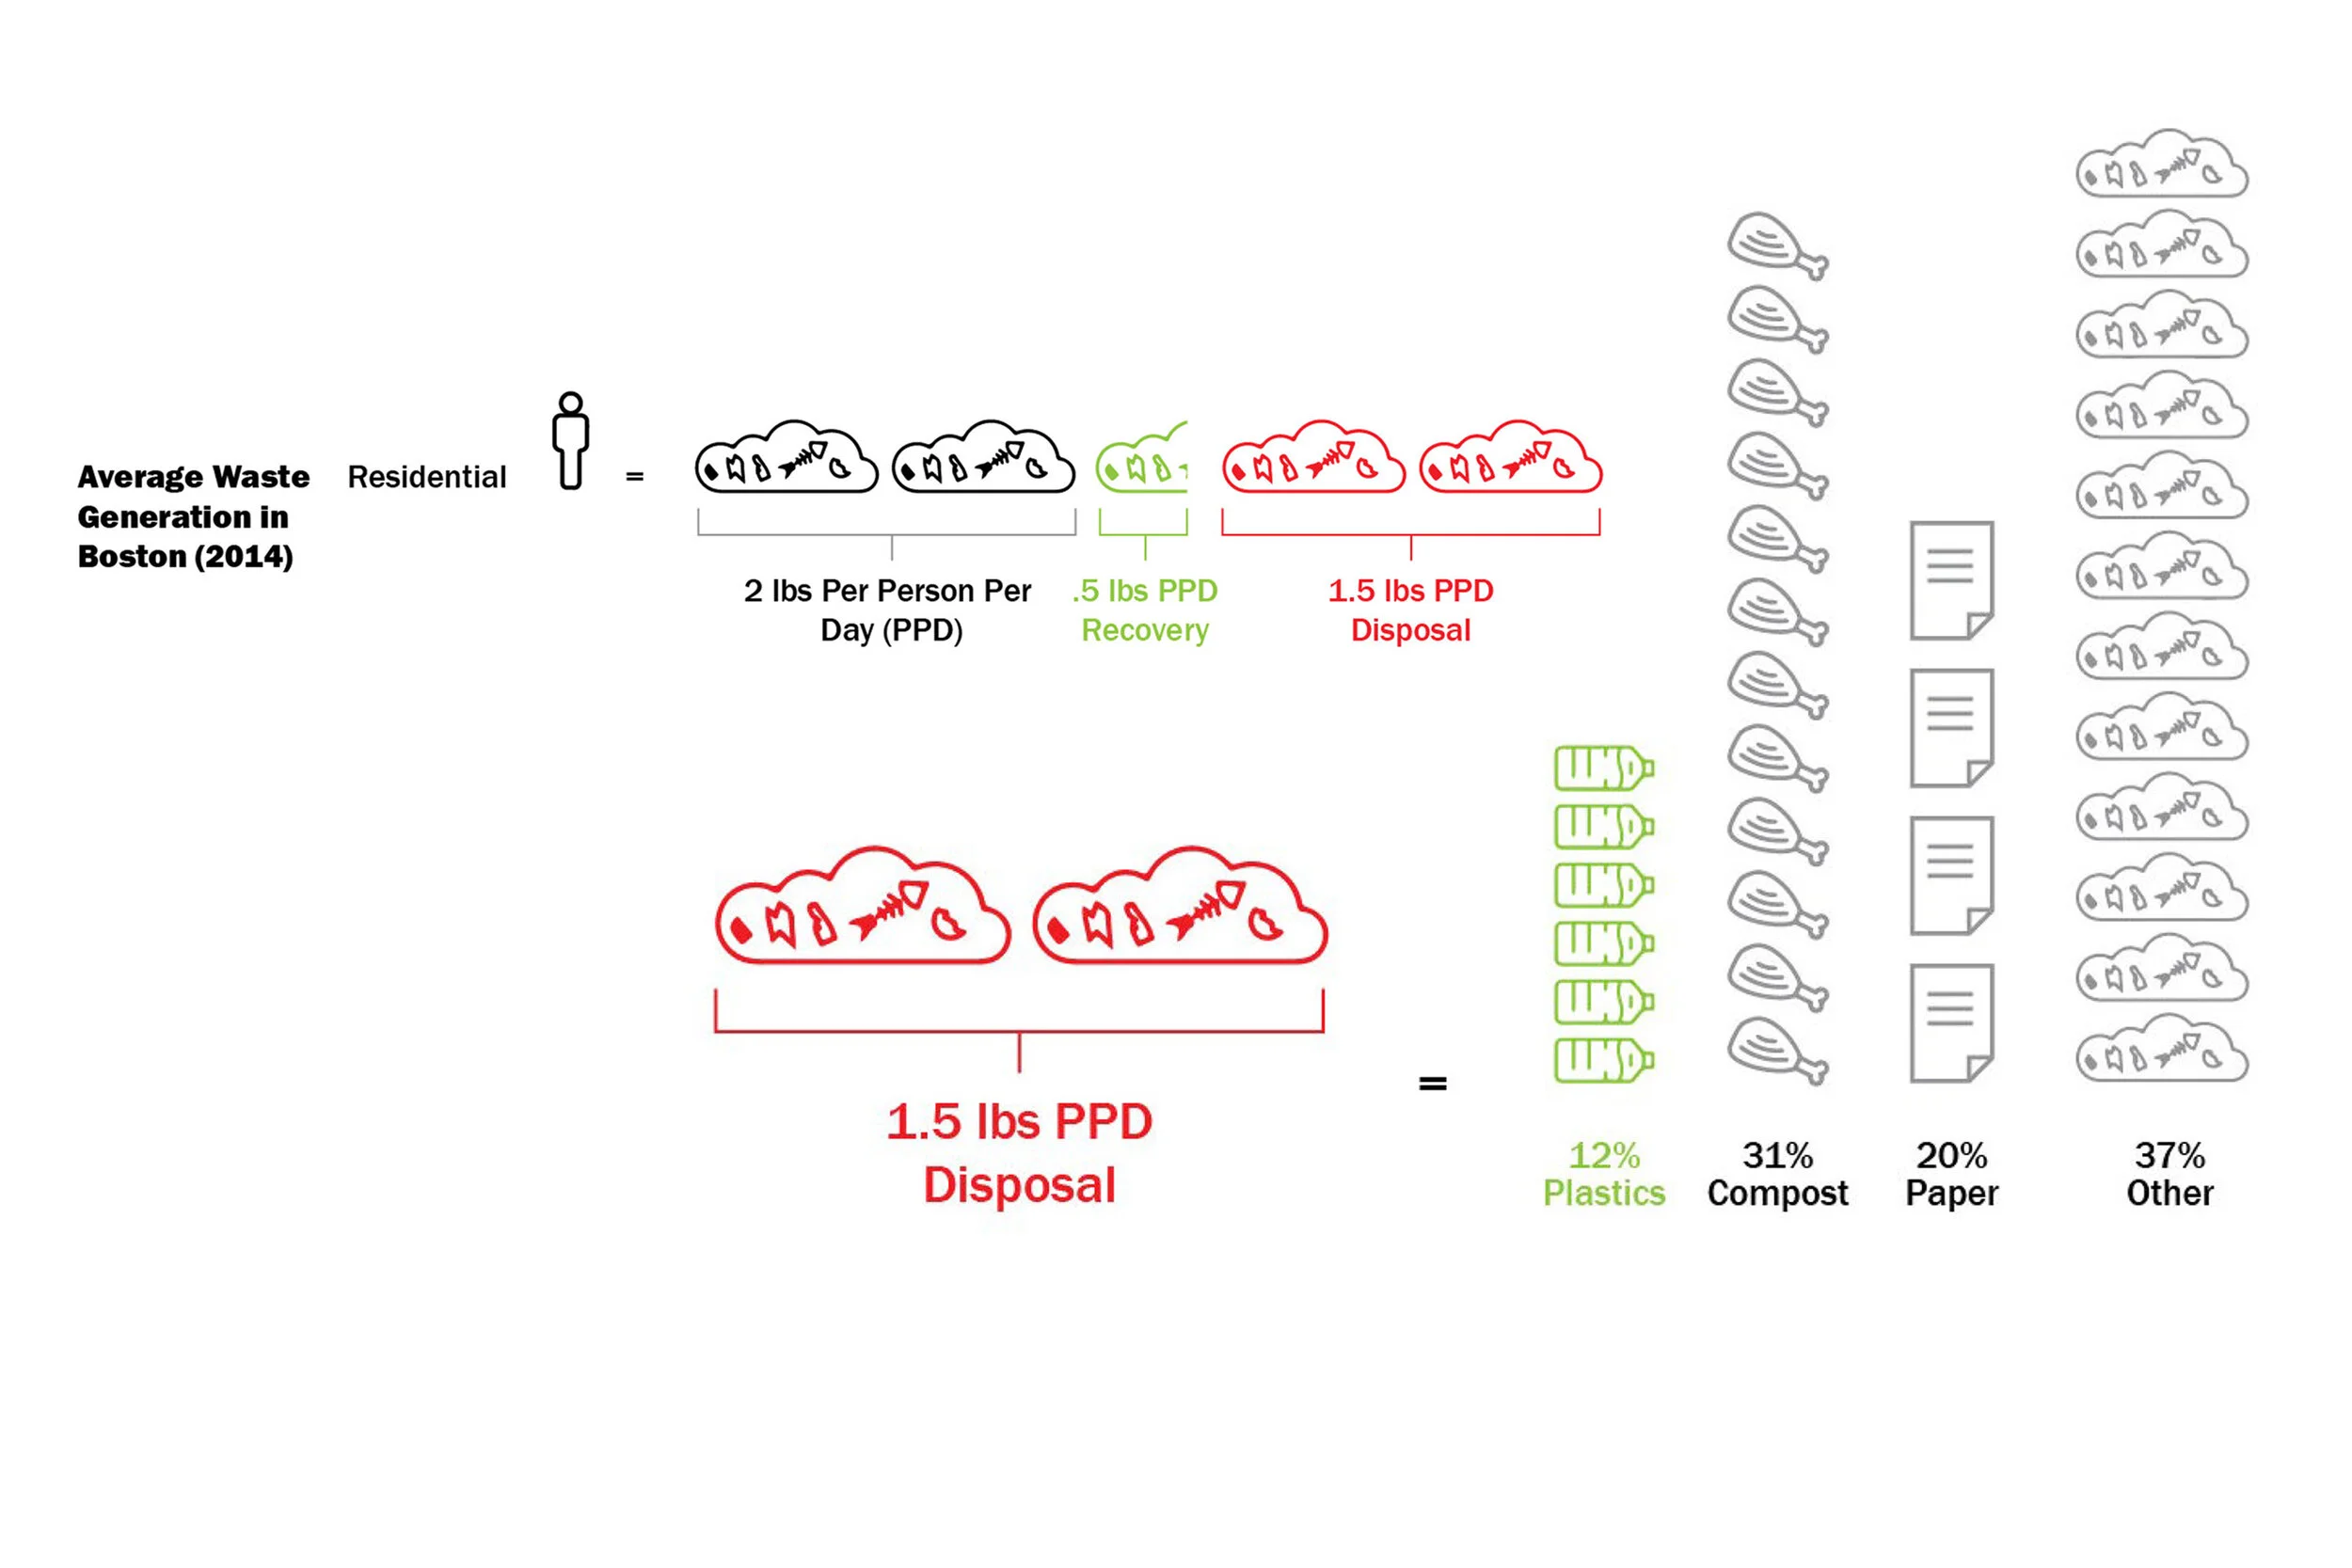
The North-East corridor of the United States serves as a sobering reminder of how much we are currently consuming and how far we still need to come with improving our consumption habits, both individually and at the institutional level. Boston spends $160 million annually of taxpayer money on trash management, and at the same time $150 million of recyclable materials are wastefully buried in landfills.
Average Waste Statistics in Boston and MSW Makeup
One of the most telling examples is in the town of Lynn, about 10 miles North-East from Boston. Here residents average approximately $2 million incinerating its trash that officials have measured is comprised of over 80% recycled material. Lynn consistently under performs at the state’s recycling rate, less than 35%.
Inspiration and Strategies
Pulling inspiration from the principles of circular models of economy (ie. Macarthur foundation), harnessing the nearly infinite raw materials of plastic waste (SLA Architects), ad-hoc / guerilla approaches to construction that challenges typical consumer models and methodologies (T*E*A*M’s Classic Order), and envisioning on a massive scale (Rania Ghosn & El Hadi Jazairy, Geographies of Trash), the final project for the studio sought to directly apply certain principles on an urban scale in Lynn.
Different Strategies for Equipping Homes in Lynn with their own Waste
It costs homes in Lynn approximately $14,300 a year to remove their trash privately. 72 million lbs of trash could be reconstituted as building material per year (per statistics from Home Advisor, 2018). If the city used their compost and plastic waste they were throwing away, each home could save $6,149 a year in private carting fees alone without changing consumption habits. How can families incentivize spending less while capitalizing on untapped plastic and compost waste?
Consider every home in Lynn being equipped with maker technology to empower homeowners to build their own additions or repairs (according to set standards) - Their waste could become the building blocks for affordable, available and reusable construction strategies against global warming affecting coastal communities that would set a precedent never before seen in the United States.
Individual House Configurations
Houses Configured En-Masse in Lynn, MA
Sources
“Colorful People’s Pavilion in Eindhoven Is Made from 100% Borrowed Materials.” https://inhabitat.com/colorful-peoples-pavilion-in-eindhoven-is-made-from-100-borrowed-materials/. / “Facts + Statistics: Homeowners and Renters Insurance | III.” https://www.iii.org/fact-statistic/facts-statistics-homeowners-and-renters-insurance. / Ghosn, Rania, and El HadiJazairy. Geographies of Trash. New York; Barcelona: ActarPublishers, 2015. ”https://taubmancollege.umich.edu/news/2016/01/26/jazairy%E2%80%99s-geographies-trash-featured-abitare. / Mohl, Bruce. “Seriously, Is This the Best We Can Do?” Informational. CommonWealthMagazine, 2015. / “T + E + A + M Clastic Order.” http://tpluseplusaplusm.us/clasticorder.html


